How mass balancing and a structured data management approach can add greater meaning to laboratory and plant data
In the mining sector, it’s essential that plant engineers and managers have confidence in the accuracy of the information they receive, especially from the plant laboratory. Recent improvements in technology and a greater understanding of the ways that data can be used means that technical staff are starting to get more out of their laboratory information; however, at many plants it can be very difficult to determine the level of accuracy and reliability of individual assay results, and therefore how useful the data is – let alone if it can be used at all.
Many sources of uncertainty
The variable nature of ore entering a plant – and its behaviour during processing – means that relatively large changes in data patterns could represent genuine scenarios. Yet, without having full confidence in the results, plant decision-makers are only able to quickly accept or discard results based on experience or very basic comparisons.
The key issue is that plant data is typically collected, aggregated and analysed manually – in some instances using fairly basic spreadsheets. As well as the risk of human error affecting results, these manual methods make it difficult to collect enough information to conduct a broad investigation, especially in a timely fashion.
In some instances, plants may utilise a basic plant information system. These systems, however, are often fairly limited in their scope and level of flexibility, which again makes it difficult to analyse results quickly or with adequate depth.
The value of metallurgical data is greatly increased when it is considered alongside other relevant information, as it is given a situational context. Without this, results cannot be effectively evaluated in terms of their accuracy and utility.
When measuring plant performance, for instance, how can a plant engineer determine if a specific tailings grade is a particularly good or bad result? Is a high value indicative of a single outlier, or a broader trend? Is a particular plant target value based on last year’s average, a simplified model or a budgeted financial number?
To truly understand assay results, we need to know where that value came from in the first place and how it relates to everything around it. Is the sample point located before the pond, or after? Is it collected from the top of the tank, or the bottom? The effect of large volumes on mixing or particle size distribution within a tank should also not be ignored.
Without examining its contextual significance, there is no way to identify if an unexpected result is an accurate representation of the plant, or if it is due to an issue with sampling, analysis or administration.
There are many steps in the sampling and analysis process that could lead to inaccuracies. A poor result could be caused by suboptimal sample collection, handling or preparation. For instance, how long was a sample held in a bottle prior to being washed? Was the sample washed?
There could also be uncontrolled instrument drift that affects the analysis, a mistake made during data entry or an error in an additional calculation. This multitude of factors can make it difficult to identify inefficiencies in the plant or to isolate issues that may impact product quality. It means that opportunities can be missed, or costs incurred that could potentially be avoided.
Creating context – structured databases and dynamic mass balancing
The solution to this context conundrum lies in having a robust plant information system that is able to take all influential factors into account and output the collated results quickly and accurately.
With the right system in place, it can be possible for engineers to cross-check results against a second comparative data set that is generated from a dynamic plant mass balance. The dynamic mass balance takes the most important information generated by the plant, such as production and ore feed rates, and uses this as the main inputs for a model of the plant. It also takes into account a broad range of other inputs – including multiple sample assay results and plant instrument data.
All of this information is used to create a second set of data, where flows, inventory changes and even chemical reactions are accounted for. The dynamic model is also able to capture volumes and residence times, which is particularly important in hydrometallurgical plants.
Automated data transfer components also allow information to be accessed, collected, evaluated and reported without any significant delays or user intervention. This automation also helps to ensure data integrity, as any corrections occur outside of the automated process and therefore can be logged.
All of this means that decision-makers can quickly determine if a laboratory result is relatively good or relatively bad. It is also possible to see the elemental mass flow between vessels, or even to determine plant inventory.
Consider the following scenario in Table 1, which uses actual plant data.
Table 1 shows a series of copper concentration laboratory assay results recorded for a leach thickener overflow stream. These numbers don’t look particularly interesting at first glance, as most appear to be relatively similar.

Table 1. Leach thickener overflow Cu concentration assay results (real plant data).
However, when these results are presented graphically in Figure 1, it becomes more obvious that there could be an issue related to this data. Is the large jump in concentration accurate? Should all of these results be used in the calculation of plant performance metrics, or by other decision-making tools?
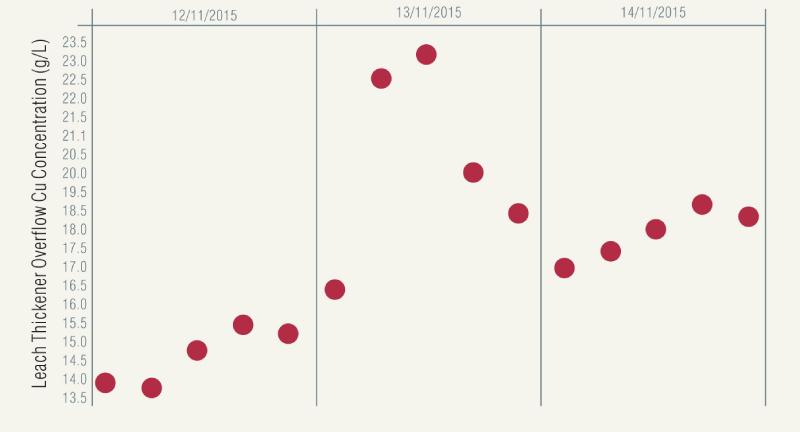
Figure 1. Leach thickener overflow Cu concentration assay results.
Without any comparative information, it is very difficult to know for certain.
First, let’s compare these assay results with those collected at the same time from similar measure points in Figure 2.
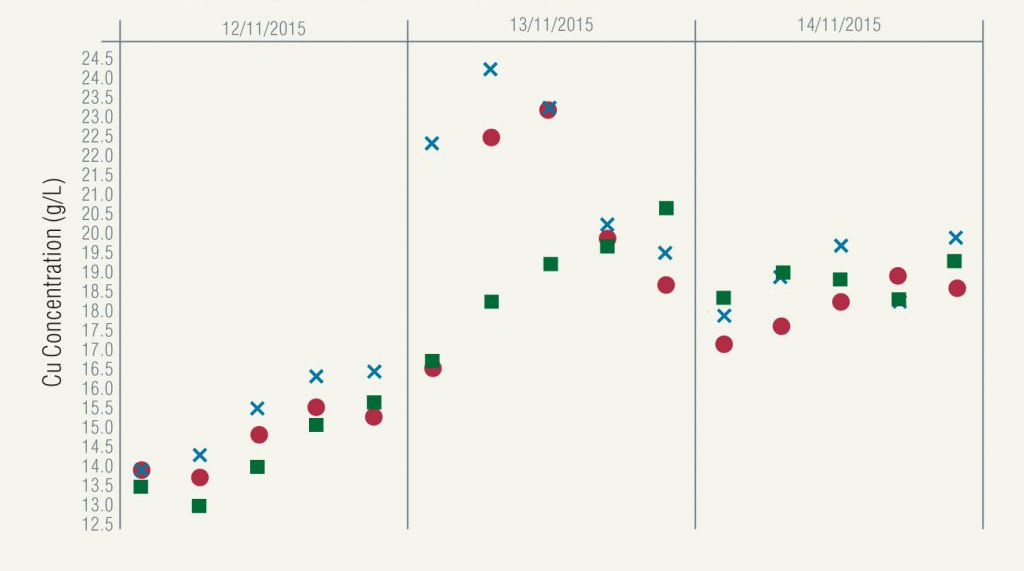
Figure 2. Leach thickener overflow (red circles), leach discharge (blue crosses) and clarifier overflow (green squares) Cu concentration assay results.
The leach discharge sample, shown as blue crosses, is collected directly upstream from the leach thickener, while the clarifier overflow sample (green squares) is the next to be collected downstream. These assays show some similarities to the leach thickener overflow assays, with the leach discharge results tracking very closely; however, the clarifier overflow assays do not appear to follow the same trend.
In Figure 3, we add in some calculated data from the dynamic mass balance and the answer becomes quite clear. The mass balance takes into account the plant feed and production to create the calculated data set, as well as flows and copper concentrations recorded both upstream and downstream.
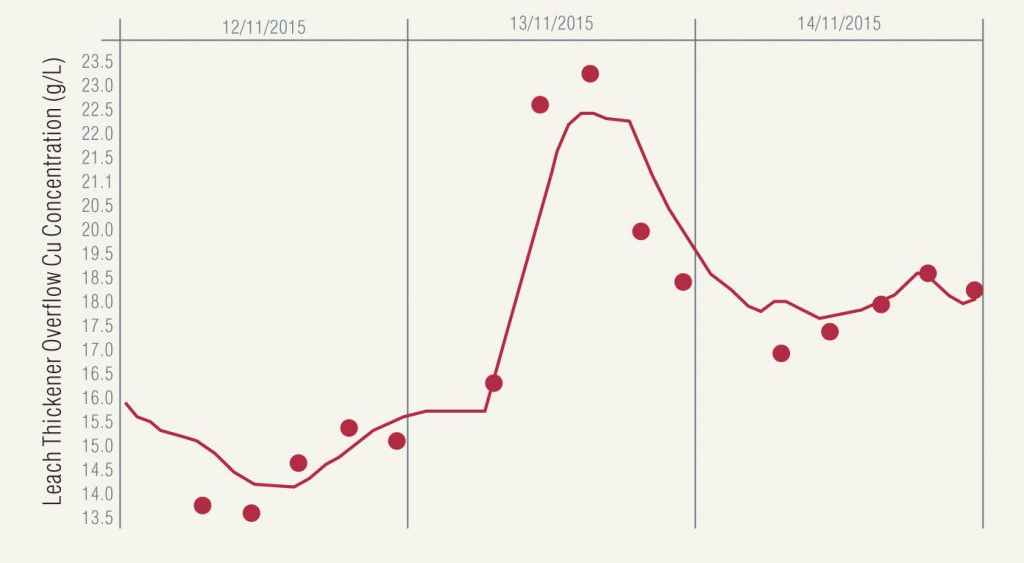
Figure 3. Leach thickener overflow Cu concentration assay results (calculated model values shown as a line).
Figures 4 and 5 indicate how context delivers even greater insight.
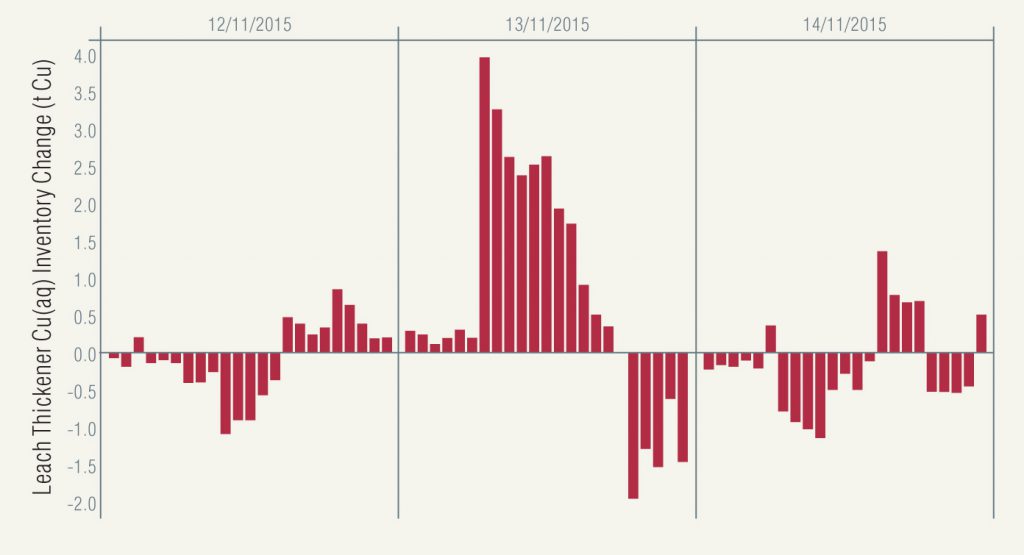
Figure 4. Leach thickener aqueous copper inventory change (copper in – copper out).
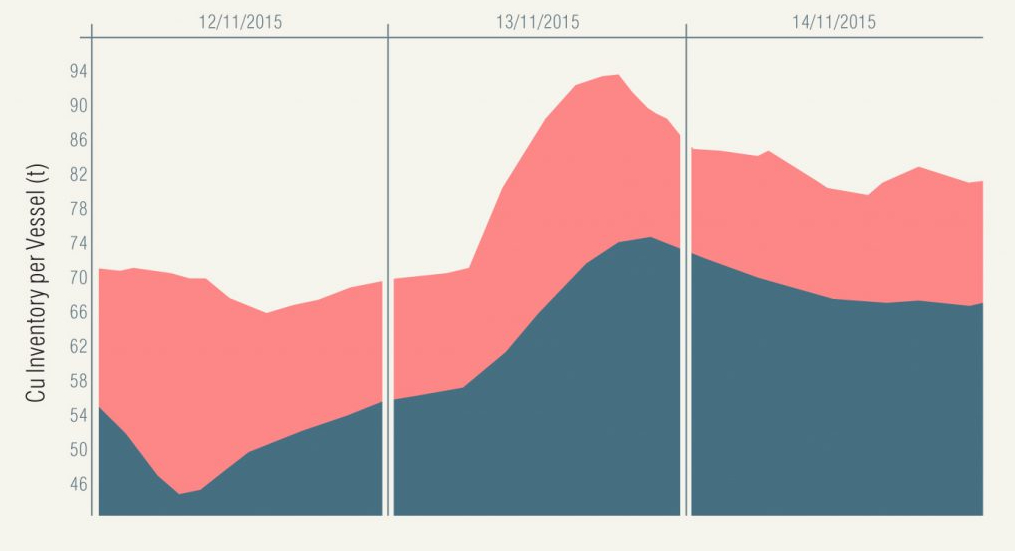
Figure 5. Copper inventory (leach thickener in red, clarifier in grey)
For instance:
- the hourly aqueous copper inventory change in the leach thickener is always less than 4 t/h and generally fluctuates between small losses and gains (Figure 4)
- yet there is a period of sustained inventory increases leading up to the recording of the high copper concentration assay
- Figure 5 shows the Cu(aq) inventory in the leach thickener overlaid with the Cu(aq) inventory in the downstream clarifier
- this shows that the two trends nearly line up, despite the slower change to the clarifier overflow copper concentration shown in Figure 2.
Such a drastic change in copper concentration might usually be blamed on a bad assay and be discarded; however, once a broader context is taken into account, it is possible to have much greater confidence that these results were, in fact, representative.
Why creating context is important
As well as enabling operators to evaluate the accuracy of laboratory data, an integrated plant information system can also help engineers and managers realise some wider benefits via access to timely, contextualised data, and include the following areas.
Reporting
With this system, it is possible to quickly and easily generate reports that combine or blend information from different sources. This greatly enhances the utility of such reports, as the broader operating context can be taken into account.
Accounting compliance
Having accurate, in-depth and fully traceable data is essential when it comes to ensuring that reporting practices are compliant with industry codes and guidelines.
Transparency
Automated data transfer is an essential method of ensuring that transparency is maintained, particularly when it comes to the generation of important plant performance metrics. It ties each piece of data right back to its source, and also records any corrections or alterations that are made.
Plant performance
Plant engineers can track utilisation, availability and efficiency at all levels from the whole plant, right down to individual equipment items. This can assist in debottlenecking and other troubleshooting practices.
Confidence in data
With the ability to quickly evaluate assay results, plant engineers also gain increased confidence in lab data, as well as the ability to diagnose issues faster and with greater effectiveness. This means that less duplicate check assays or other troubleshooting measures are required, leading to potential time and cost savings.
Conclusion
In summary, adopting an integrated solution for handling laboratory and plant data is becoming increasingly imperative. The ability to analyse information in a much more detailed context – enabled through structured databases and a dynamic plant mass balance – gives laboratory and plant data even greater meaning. It also gives engineers and managers more confidence in the accuracy of their data, making it easier to identify problems or opportunities within their plant.